Last week I found myself dealing with the issue , of my Java application repeatedly freezing …i guessed it could be due to a thread deadlock but wasn’t exactly sure which part of my code was the cause. Since I already had a license of a Commercial Java Profiler I thought things would be easy..but unfortunately the profiler didnt seem to auto connect to my running vm unless I explicitly gave it the port no.
Having heard a lot about Visual VM , I decided to give it a try and was surprised to find that it auto detected my running vm on startup and gave a brief summary of the vm properties.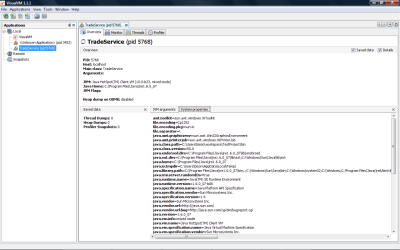
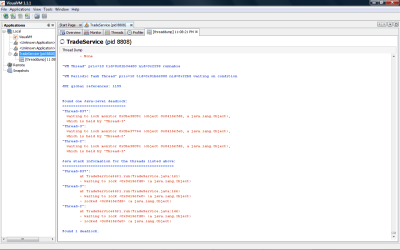
The next thing I did was to take a thread dump of my application and analyze it for any deadlocks..and Visual VM saved my day here ,by auto detecting the deadlock from the Thread Dump .The explanation given..was quite clear and helped fix the dealock issue.
Once this critical issue was fixed I decided to see what else Visual Vm had to offer and have listed some of its interesting features :
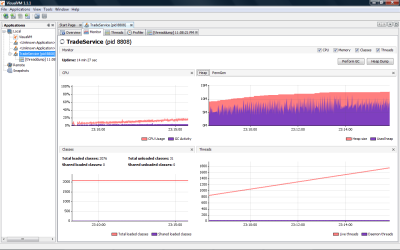
1) Get a Performance Overview of the entire application..like the no of Live Threads ,Classes Loaded ,Heap Memory usage in the Monitor Tab. The Threads tab in turn allows a deeper insight into all the system and user threads.
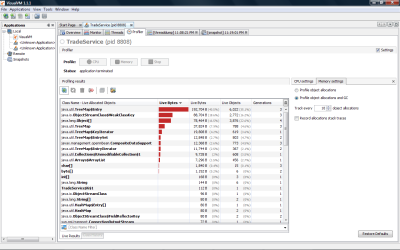
2) Profile the memory usage of an application using the Profiler Tab. This view allows us to profile objects of the classes that we are interested in..and shows the size & No of Live Objects. We can also take a snapshot of the profiler output to analyse further and either save it as an image or a custom .nps format .
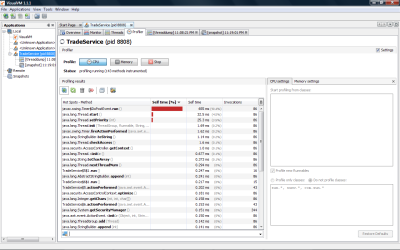
3) Profile the cpu usage of an application using the Profiler Tab. This view basically shows the method invocation count and time taken for execution. Again we can filter based on the methods names that we are interested in.
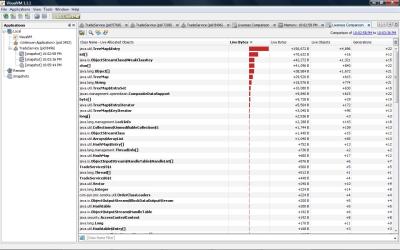
4) The Ability to Compare Profiled Memory Snapshots,from the File Menu, is another very useful feature..which helps to analyse the memory usage of the application ,taken at various stages.
A few features which I felt , could make VisualVm much more complete , in order of preference are :
1) Automatic Deadlock Detection and Notification of a Running application at any point during its lifetime, without having to explictly lookup its Thread Dump.
2) Finding all paths to a given Object from the various roots would help in fixing memory leaks much more quickly , than having to find it manually.
3) Graphical Representation of the profiling results in realtime would be much easier to comprehend over a long period of time, than having a tabular display.
4) An option to freeze all the views for the currently profiled application,instead of taking indivisual snapshots of the views.
Conclusion:
Java VisualVM combines several monitoring, troubleshooting, and profiling utilities into a single tool and is extensibe using the Visual VM Entry Points. Most of the functionality offered by the standalone tools such as jmap, jstat and jstack have been integrated into Java VisualVM. The best part is that it is open source & since JDK 6 Update 7 ,has been bundled into the standard JDK as ‘jvisualvm.exe’ .


